

Get Ready with 1z1-084 Exam Dumps (2025)
Realistic 1z1-084 Dumps are Available for Instant Access
NEW QUESTION # 32
Which two statements are true about disabling Automatic Shared Memory Management (ASMM)?
- A. All SGA components retain their current sizes at the time of disabling.
- B. It requires a database instance restart to take effect.
- C. Both SGA_TARGET and SGA_MAX_SIZE must be set to zero.
- D. The SGA size remains unaffected after disabling ASMM.
- E. All SGA components excluding fixed SGA and other internal allocations are readjusted immediately after disabling ASMM.
- F. All auto-tuned SGA components are reset to their original user-defined values.
Answer: A,D
Explanation:
When ASMM is disabled, the sizes of the automatically managed SGA components remain at their current values. ASMM is controlled by theSGA_TARGETparameter. IfSGA_TARGETis set to a non-zero value, ASMM is enabled and Oracle will automatically manage the sizes of the various SGA components. When ASMM is disabled, by settingSGA_TARGETto zero, the SGA components that were automatically sized will retain their current sizes rather than being reset to their original user-defined values. The overall size of the SGA remains the same unless manually changed by modifying individual component sizes or SGA_MAX_SIZE.
References:
* Oracle Database Administration Guide, 19c
* Oracle Database Performance Tuning Guide, 19c
NEW QUESTION # 33
You need to transport performance data from a Standard Edition to an Enterprise Edition database. What is the recommended method to do this?
- A. Export the data by using expdp from Statspack and import it by using $ORACLE_HOME/rdbms/admin
/awrload into the AWR repository. - B. Export the data by using the expdp utility and parameter file spuexp.par from the Statspack repository and import it by using impdp into Export the data by using expdp from the Statspack repository and import it by using impdp into the AWR repository.
- C. Export the data by using expdp from the ftatspack repository and import it by using impdp into the AWR repository.
- D. Export the data by using the exp utility and parameter file spuexp.par from the Statspack repository and import it by using imp into a dedicated Statspack schema on the destination.
Answer: D
Explanation:
To transport performance data from an Oracle Database Standard Edition, which uses Statspack, to an Enterprise Edition database, which uses AWR, you must consider the compatibility of data structures and repository schemas between these tools. The recommended method is:
* D (Correct): Export the data using the exp utility with a parameter file appropriate for Statspack (like spuexp.par) from the Statspack repository and import it into a dedicated Statspack schema on the destination. Since Statspack and AWR use different schemas, it's not recommended to import Statspack data directly into the AWR repository.
The other options are incorrect because:
* A (Incorrect): expdp is not designed to export from Statspack, and awrload is intended for loading from an AWR export file, not a Statspack export.
* B (Incorrect): Although expdp and impdp are used for exporting and importing data, the AWR repository schema is different from the Statspack schema, so importing Statspack data directly into the AWR repository is not recommended.
* C (Incorrect): Using expdp to export from Statspack and then importing directly into the AWR repository is not the correct approach due to the schema differences between Statspack and AWR.
References:
* Oracle Database Performance Tuning Guide: Migrating from Statspack to AWR
NEW QUESTION # 34
Database performance has degraded recently.
index range scan operations on index ix_sales_time_id are slower due to an increase in buffer gets on sales table blocks.
Examine these attributes displayed by querying DBA_TABLES:
Now, examine these attributes displayed by querying DBA_INDEXES:
Which action will reduce the excessive buffer gets?
- A. Partition index IX_SALES_TIME_ID using hash partitioning.
- B. Re-create the SALES table using the columns in IX_SALES_TIME_ID as the hash partitioning key.
- C. Re-create index IX_SALES_TIME_ID using ADVANCED COMPRESSION.
- D. Re-create the SALES table sorted in order of index IX_SALES_TIME_ID.
Answer: C
Explanation:
Given that index range scan operations onIX_SALES_TIME_IDare slower due to an increase in buffer gets, the aim is to improve the efficiency of the index access. In this scenario:
* B (Correct):Re-creating the index usingADVANCED COMPRESSIONcan reduce the size of the index, which can lead to fewer physical reads (reduced I/O) and buffer gets when the index is accessed, as more of the index can fit into memory.
The other options would not be appropriate because:
* A (Incorrect):Re-creating theSALEStable sorted in order of the index might not address the issue of excessive buffer gets. Sorting the table would not improve the efficiency of the index itself.
* C (Incorrect):Using the columns inIX_SALES_TIME_IDas a hash partitioning key for theSALES table is more relevant to data distribution and does not necessarily improve index scan performance.
* D (Incorrect):Hash partitioning the index is generally used to improve the scan performance in a parallel query environment, but it may not reduce the number of buffer gets in a single-threaded query environment.
References:
* Oracle Database SQL Tuning Guide:Managing Indexes
* Oracle Database SQL Tuning Guide:Index Compression
NEW QUESTION # 35
During which application lifecycle phase do you take baselines?
- A. Deployment
- B. Migration or upgrade
- C. Production
- D. Design and development
- E. Testing
Answer: C
Explanation:
Baselines are typically taken during the production phase of the application lifecycle. They provide a snapshot of performance metrics under normal operating conditions which can be used for comparison against future performance. Baselines are essential for understanding how the system performs under its typical workload and for detecting deviations from this expected performance over time, especially after changes like migrations, upgrades, or significant changes in user activity.
References
* Oracle Database 19c Performance Tuning Guide - Managing Performance Through Baselines
NEW QUESTION # 36
Which two Oracle Database features use database services?
- A. Database Resource Manager
- B. Oracle Automatic Reoptimization
- C. Oracle SQL Performance Management
- D. Oracle SQL Tuning Advisor
- E. Oracle Scheduler
Answer: A,E
Explanation:
Database services in Oracle are used to manage how resources are allocated and how workloads are managed within the database. The features that use database services are:
* B (Correct):Database Resource Manager (DBRM) uses services to control resource allocation to different workloads. It ensures that resources are assigned to the most critical tasks first, based on the service associated with the workload.
* E (Correct):Oracle Scheduler can also utilize database services. Jobs in Oracle Scheduler can be assigned to different services to control resource allocation and prioritization.
The other features mentioned are related to SQL performance but do not directly utilize database services in the way Resource Manager and Scheduler do:
* A:Oracle Automatic Reoptimization is a feature that allows the database to automatically improve the execution plan of a SQL statement after it is executed, based on the actual performance metrics, but it does not directly use database services.
* C:Oracle SQL Performance Management involves various components of SQL tuning and monitoring, but it does not use database services to operate.
* D:Oracle SQL Tuning Advisor provides advice on how to tune SQL queries for better performance.
While it can be used in conjunction with services for managing and analyzing workloads, it doesn't use services in its core functionality.
References:
* Oracle Database Administrator's Guide:Administering Services
* Oracle Database Administrator's Guide:Managing Resources with Oracle Database Resource Manager
* Oracle Database Scheduler Developer's Guide:Using the Scheduler
NEW QUESTION # 37
Multiple sessions are inserting data concurrently into a table that has an LOB column.
At some point in time, one of the sessions cannot find available space in the LOB segment and needs to allocate a new extent.
Which wait event will be raised in the other sessions that need space in the LOB column?
- A. enq: TX - allocate ITL entry
- B. enq: TM - contention
- C. enq: HW - contention
- D. enq: SQ - contention
Answer: C
Explanation:
When sessions concurrently insert data into a table with an LOB column and one session needs to allocate a new extent because it cannot find available space, the wait event associated with this contention is "enq: HW - contention". The HW stands for High Water Mark which is related to space allocation in the database segment.
When asession needs to allocate a new extent, it may raise this wait event in other sessions that are also attempting to allocate space in the same LOB segment.
References
* Oracle Database 19c Reference Guide - enq: HW - contention
NEW QUESTION # 38
Examine this statement and output: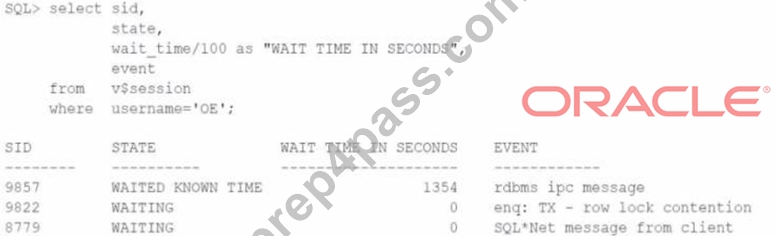
Which three statements are true?
- A. Session 8779 may be waiting due to a network problem.
- B. Session 9857 is not waiting.
- C. Session 9822 will always stop waiting if the session that owns the TX enqueue issues a COMMIT statement as session 9822 is the first session in the transaction queue.
- D. Both 9822 and 8779 sessions are waiting for operating system resources.
- E. Session 9857 waited 1354 seconds for another process, which was also waiting for a transaction to end.
- F. Session 8779 may be waiting for a user or application response.
Answer: A,C,F
Explanation:
For this SQL statement and output, we can analyze the EVENT column to understand the type of wait:
B: The event "SQL*Net message from client" typically indicates that the session is waiting for a response from the client. This can be due to a network issue, user response, or an application processing delay.
E: The event "SQL*Net message from client" also implies that the session is idle waiting for the client (a user or an application) to send a request to the server. This event usually indicates that the session is not actively working but is instead waiting for the next command.
F: The wait event "enq: TX - row lock contention" suggests that session 9822 is waiting for a row-level lock held by another session. If the holding session issues a COMMIT or ROLLBACK, the lock will be released, and session 9822 will stop waiting. Since this session is experiencing row lock contention, it implies it's waiting for a specific transaction to complete.
References:
* Oracle Database Reference, 19c
* Oracle Wait Events Documentation
NEW QUESTION # 39
Accessing the SALES tables causes excessive db file sequential read wait events.
Examine this AWR except:
Now, examine these attributes displayed by querying dba_tables:
Finally, examine these parameter settings: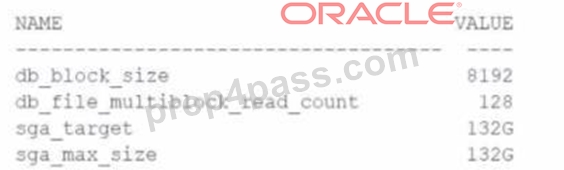
Which two must both be used to reduce these excessive waits?
- A. Re-create the SALES table.
- B. Increase PCTFREE for the SALES table.
- C. Partition the SALES table.
- D. Compress the SALES table.
- E. Coalesce all sales table indexes.
Answer: C,D
Explanation:
The AWR excerpt points to excessive physical reads on the SALES table and index, suggesting the need for optimizing table storage and access.
Partitioning the SALES table (A) can reduce 'db file sequential read' waits by breaking down the large SALES table into smaller, more manageable pieces. This can localize the data and reduce the I/O necessary for query operations.
Compressing the SALES table (D) can also help reduce I/O by minimizing the amount of data that needs to be read from disk. This can also improve cache utilization and reduce the 'db file sequential read' waits.
References:
* Oracle Database VLDB and Partitioning Guide, 19c
* Oracle Database Administrator's Guide, 19c
These changes are recommended based on Oracle's best practices for managing large tables and reducing I/O waits, ensuring better performance and efficiency.
NEW QUESTION # 40
Users complain about slowness and session interruptions. Additional checks reveal the following error in the application log:
Which file has additional information about this error?
- A. SQL trace file automatically generated by the error
- B. ASH report
- C. Alert log
- D. Session trace file SQL trace file automatically generated by the error
Answer: C
Explanation:
When an ORA-00060 deadlock error occurs, detailed information about the error and the deadlock graph are dumped into the alert log. This log contains a trace file name that you can use to find additional detailed information about the sessions involved in the deadlock and the SQL statements they were executing.
References:
* Oracle Database Administrator's Guide, 19c
* Oracle Database Error Messages, 19c
NEW QUESTION # 41
What is the right time to stop tuning an Oracle database?
- A. When the I/O is less than 10% of the DB time
- B. When the tuning goal has been met
- C. When the buffer cache and library cache hit ratio is above 95%
- D. When all the concurrency waits are eliminated from the Top 10
- E. When the allocated budget for performance tuning has been exhausted
Answer: B
Explanation:
The objective of performance tuning in Oracle Database is to meet specific performance goals. These goals may vary based on the requirements of the system and business objectives. Let's evaluate each option in detail to understand why E is correct and others are not.
Option Analysis:
* A. When the allocated budget for performance tuning has been exhausted
* Why it's incorrect:
* Tuning should not stop simply because the budget is exhausted. If performance goals are not met, the database might still experience performance issues, impacting the end-users or business-critical processes. Budget is a constraint, but it shouldn't define when tuning stops.
* B. When all the concurrency waits are eliminated from the Top 10
* Why it's incorrect:
* Concurrency waits (such as locks or latches) are just one aspect of database performance tuning. Eliminating these waits does not necessarily mean the system meets its performance goals. Other factors like query optimization, I/O performance, and CPU usage might still need attention.
* C. When the buffer cache and library cache hit ratio is above 95%
* Why it's incorrect:
* Cache hit ratios are often overemphasized as a performance metric. While a high hit ratio indicates efficient memory usage, it doesn't guarantee optimal performance. A high ratio could still mask inefficient SQL queries, suboptimal execution plans, or other bottlenecks.
* D. When the I/O is less than 10% of the DB time
* Why it's incorrect:
* While reducing I/O is beneficial, it is not always a sufficient indicator that tuning can stop.
Certain workloads may inherently have high or low I/O percentages. The real question is whether the database is meeting its required service levels, not just reducing I/O.
* E. When the tuning goal has been met
* Why it's correct:
* The purpose of performance tuning is to meet the specific performance goals set by the business or the database administrators. Once the database meets these goals (e.g., query response times, throughput requirements, or SLA commitments), tuning can stop. This ensures effort is focused on achieving measurable outcomes, rather than chasing arbitrary metrics.
The Importance of Defining a Tuning Goal
Performance tuning should be driven by clear goals such as:
* Reducing response time for specific critical queries.
* Meeting SLAs for application performance.
* Supporting a target number of concurrent users.
* Reducing resource contention for improved scalability.
Tuning should stop once these goals are achieved because continuous tuning without purpose can lead to unnecessary complexity and resource usage.
Reference to Oracle Documentation:
* Oracle Database 19c Performance Tuning Guide:
* Section: Establishing Performance Goals and Metrics.
* Discussion on focusing tuning efforts on business requirements and goals.
* Oracle Database Concepts Guide:
* Best practices for balancing performance improvements with system complexity.
NEW QUESTION # 42
Which two statements are true about space usage in temporary tablespaces?
- A. A sort will fail if a sort to disk requires more disk space and no additional extent can be found/allocated in/for the sort segment.
- B. Lack of temporary tablespace space for sort operations can be prevented by using temporary tablespace groups.
- C. Temporary tablespaces setting Includes quotas to limit temporary space used by a session for that Temporary tablespace.
- D. When a global temporary table instantiation is too large to fit in memory, space is allocated in a temporary tablespace.
- E. When a session consumes all temporary tablespace storage, then the session would hang until the temporary space used by that session is cleared.
Answer: B,D
Explanation:
Regarding space usage in temporary tablespaces, the following statements are true:
* A (Correct):When a global temporary table or a sort operation exceeds the available memory, Oracle Database allocates space in a temporary tablespace to store the temporary data or intermediate results.
* E (Correct):Using temporary tablespace groups can prevent insufficient temporary tablespace for sort operations by providing a collective pool of space from multiple temporary tablespaces, which can be used for user sorting operations.
The other options provided have inaccuracies:
* B (Incorrect):Oracle does not provide a mechanism for setting quotas on temporary tablespaces. Quotas can be set for permanent tablespaces but not for temporary ones.
* C (Incorrect):A sort operation may fail due to insufficient space, but Oracle will attempt to allocate space in the temporary tablespace dynamically. If no space can be allocated, an error is returned rather than a sort failure.
* D (Incorrect):If a session consumes all available temporary tablespace storage, Oracle will not hang the session; it will return an error to the session indicating that it has run out of temporary space.
References:
* Oracle Database Administrator's Guide:Managing Space for Schema Objects
* Oracle Database Concepts:Temporary Tablespaces
NEW QUESTION # 43
Examine this code block, which executes successfully:
DBMS_SERVER_ALERT. SET_THRESHOLD (
DBMS_SERVER_ALERT.CPU_TIME_PER_CALL, DBMS_SERVER_ALERT. OPERATOR_GE, '8000', DBMS_SERVER_ALERT.OPERATOR_GE, '10000', 1, 2, 'inst1', DBMS_SERVER_ALERT.OBJECT_TYPE_SERVICE, 'main.regress.rdbms.dev.us.example.com') ;
What will happen?
- A. A warning alert will be issued only when CPU time exceeds 10000 microseconds for each user call.
- B. A critical alert will be issued when CPU time exceeds 2 minutes for each user call.
- C. A warning alert will be issued when CPU time exceeds 1 minute for each user call.
- D. A critical alert will be issued when CPU time exceeds 10000 microseconds for each user call.
Answer: D
Explanation:
In the provided code block, theDBMS_SERVER_ALERT.SET_THRESHOLDprocedure is used to set alert thresholds for the CPU time per call in Oracle Database. This procedure is a part of Oracle's Database Server Alert system, which monitors various metrics and generates alerts when certain thresholds are exceeded.
The parameters passed to theSET_THRESHOLDprocedure are as follows:
* The first parameterDBMS_SERVER_ALERT.CPU_TIME_PER_CALLspecifies the metric for which the threshold is being set, in this case, the CPU time consumed per database call.
* The second and third parametersDBMS_SERVER_ALERT.OPERATOR_GEand'8000'specify the warning threshold level and its value, respectively. However, these are not relevant to the answer as they are overridden by the critical threshold settings.
* The fourth and fifth parametersDBMS_SERVER_ALERT.OPERATOR_GEand'10000'set the critical threshold level and its value. This means that a critical alert will be generated when the CPU time per call exceeds 10000 microseconds.
* The remaining parameters specify the warning and critical alert intervals, the instance name, the object type, and the service name. These are not directly relevant to the behavior described in the options.
Thus, the correct answer is B, as the critical threshold for CPU time per call is set to 10000 microseconds, and the system is configured to issue a critical alert when this threshold is exceeded.
References:
* Oracle Database 19c documentation on theDBMS_SERVER_ALERT.SET_THRESHOLDprocedure, which details the parameters and usage of this procedure for setting alert thresholds within Oracle Database monitoring system.
* Oracle Database Performance Tuning Guide, which provides best practices and methodologies for monitoring and tuning Oracle Database performance, including the use of server alerts and thresholds.
NEW QUESTION # 44
Which two statements are true about the use and monitoring of Buffer Cache Hit ratios and their value in tuning Database I/O performance?
- A. The performance of workloads that primarily generate full table scans and fast full index scans are always affected by the cache hit ratio.
- B. The buffer cache advisory view v$db_cache_advice provides advice on cache hit ratios appropriate for the instance workload.
- C. A 60% cache hit ratio can be observed for database instances which have very good I/O performance.
- D. A 99% cache hit ratio can be observed for database instances which have very poor I/O performance.
- E. Both the RECYCLE and KEEP buffer caches should always have a very high cache hit ratio.
Answer: B,D
Explanation:
A high buffer cache hit ratio typically indicates that the database is effectively using the buffer cache and does not often need to read data from disk. However, this metric alone is not a reliable indicator of the I/O performance of the database for several reasons:
* Full table scans and fast full index scans (A) can bypass the buffer cache by design if the blocks are not
* deemed reusable shortly, which can impact the cache hit ratio.
* A high cache hit ratio (B) can be misleading if the database performance is poor due to other factors, such as inefficient queries or contention issues.
* The buffer cache advisory (C) is a more valuable tool for understanding the potential impact of different cache sizes on the database's I/O performance. It simulates scenarios with different cache sizes and provides a more targeted recommendation.
* The RECYCLE and KEEP buffer caches (D) are specialized caches designed for certain scenarios.
While high hit ratios can be beneficial, they are not universally required; some workloads might not be significantly impacted by lower hit ratios in these caches.
* A lower cache hit ratio (E) does not necessarily mean poor I/O performance. In some cases, a system with a well-designed storage subsystem and efficient queries might perform well even with a lower cache hit ratio.
References
* Oracle Database 19c Performance Tuning Guide - Buffer Cache Hit Ratio
* Oracle Database 19c Performance Tuning Guide - v$db_cache_advice
NEW QUESTION # 45
Examine this statement and its corresponding execution plan: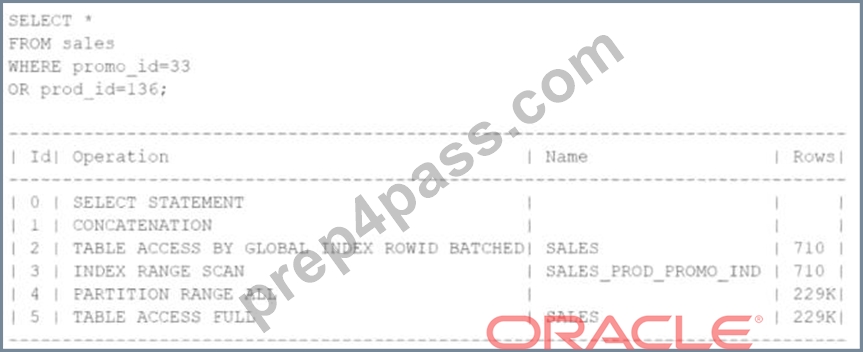
Which phase introduces the CONCATENATION step?
- A. SQL Transformation
- B. SQL Execution
- C. SQL Semantic Check
- D. SQL Adaptive Execution
- E. SQL Row Source Generation
Answer: A
Explanation:
The CONCATENATION step in an execution plan is introduced during the SQL Transformation phase. This phase is part of the optimizer's query transformations which can include various techniques to rewrite the query for more efficient execution. The CONCATENATION operation is used to combine the results of two separate SQL operations, typically when there is an OR condition in the WHERE clause, as seen in the provided query.
References:
* Oracle Database SQL Tuning Guide, 19c
* Oracle Database Concepts, 19c
NEW QUESTION # 46
Examine this output of a query of VSPGA_TAPGET_ADVICE: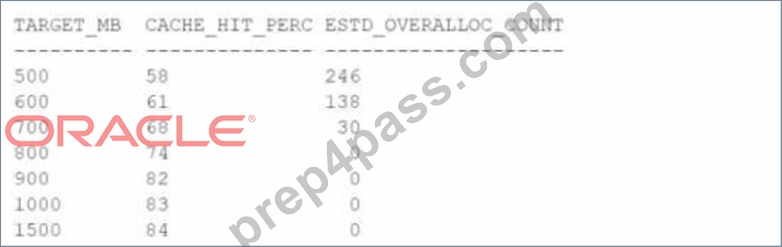
Which statements is true'
- A. With a target of 800 MB or more, all one-pass execution work areas would be eliminated.
- B. GGREGATE_TARGET should be set to at least 700 MB.
- C. With a target of 700 MB or more, all multipass executions work areas would be eliminated.
- D. PGAA_AGGREGATE should be set to at least 800 MB.
Answer: A
Explanation:
The query output from V$PGA_TARGET_ADVICE provides tuning information for the PGA (Program Global Area). Let's break it down step by step:
Key Columns in the Output:
* TARGET_MB:
* Represents the hypothetical PGA_AGGREGATE_TARGET values (in megabytes) evaluated by Oracle.
* CACHE_HIT_PERC:
* The percentage of work areas that could execute in-memory (optimal execution) without requiring temporary disk writes.
* Higher percentages indicate fewer work areas requiring disk I/O.
* ESTD_OVERALLOC_COUNT:
* The estimated number of work areas that need to go to disk (multipass operations or overallocations).
Observations from the Data:
* At TARGET_MB = 700 MB:
* The CACHE_HIT_PERC is 68%.
* The ESTD_OVERALLOC_COUNT is 30. This indicates that some multipass work areas still exist.
* At TARGET_MB = 800 MB:
* The CACHE_HIT_PERC rises to 74%.
* The ESTD_OVERALLOC_COUNT drops to 0. This indicates that no work areas require multipass execution.
* At TARGET_MB = 900 MB and above:
* The CACHE_HIT_PERC increases slightly to 82%-84%.
* The ESTD_OVERALLOC_COUNT remains 0, meaning that all work areas are now either optimal or one-pass.
Why D is Correct:
* At 800 MB or more, the ESTD_OVERALLOC_COUNT is 0, indicating that all one-pass execution work areas are eliminated.
* A one-pass execution requires temporary disk I/O for intermediate results, but with sufficient PGA, these are no longer necessary.
Why Other Options Are Incorrect:
* Option A:
* It mentions all multipass executions work areas would be eliminated at 700 MB. This is incorrect because, at 700 MB, the ESTD_OVERALLOC_COUNT is still 30, indicating some multipass work areas still exist.
* Option B:
* Suggests setting the PGA_AGGREGATE_TARGET to at least 800 MB, which is partially correct but does not address the elimination of one-pass execution.
* Option C:
* Suggests setting the PGA_AGGREGATE_TARGET to at least 700 MB, which is not sufficient to eliminate all one-pass executions, as shown by the ESTD_OVERALLOC_COUNT of 30.
NEW QUESTION # 47
Examine this statement and output: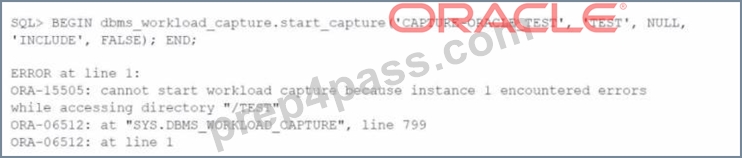
Which two situations can trigger this error?
- A. There is a file in the capture directory.
- B. The syntax is incomplete.
- C. The capture directory is part of the root file system.
- D. The user lacks the required privileges to execute the DBMS WORKLOAD CAPTURE package or the directory.
- E. The instance is unable to access the capture directory.
Answer: D,E
Explanation:
The ORA-15505 error indicates that the instance encountered errors while trying to access the specified directory. This could be due to:
A: Insufficient privileges: The user attempting to start the workload capture might not have the required permissions to execute the DBMS_WORKLOAD_CAPTURE package or to read/write to the directory specified.
E: Accessibility: The database instance may not be able to access the directory due to issues such as incorrect directory path, directory does not exist, permission issues at the OS level, or the directory being on a file system that's not accessible to the database instance.
References:
* Oracle Database Error Messages, 19c
* Oracle Database Administrator's Guide, 19c
NEW QUESTION # 48
......
Download Exam 1z1-084 Practice Test Questions with 100% Verified Answers: https://www.prep4pass.com/1z1-084_exam-braindumps.html
Share Latest 1z1-084Test Practice Test Questions, Exam Dumps: https://drive.google.com/open?id=1LLBDHULxLRkU7Fa9g2MPmrTCDLk1Z0os
