

Try DY0-001 Free Now! Real Exam Question Answers Updated [Aug 20, 2026]
Get Ready to Pass the DY0-001 exam with CompTIA Latest Practice Exam
NEW QUESTION # 15
Which of the following layer sets includes the minimum three layers required to constitute an artificial neural network?
- A. An input layer, a pooling layer, and an output layer
- B. An input layer, a dropout layer, and a hidden layer
- C. An input layer, a convolutional layer, and a hidden layer
- D. An input layer, a hidden layer, and an output layer
Answer: D
Explanation:
By definition, an artificial neural network requires at least these three fundamental layers: the input layer to receive data, one or more hidden layers to perform transformations, and the output layer to produce predictions. Pooling, convolutional, and dropout layers are useful in specialized architectures (e.g., CNNs) but aren't part of the minimal ANN structure.
NEW QUESTION # 16
Which of the following is a classic example of a constrained optimization problem?
- A. Calculating local maximum
- B. Calculating gradient descent
- C. The cold start problem
- D. The traveling salesman
Answer: D
Explanation:
The traveling-salesman problem seeks the shortest possible route that visits each city exactly once and returns to the start, making it a textbook example of optimization under explicit constraints.
NEW QUESTION # 17
A data scientist wants to evaluate the performance of various nonlinear models. Which of the following is best suited for this task?
- A. ANOVA
- B. MCC
- C. Chi-squared test
- D. AIC
Answer: D
NEW QUESTION # 18
SIMULATION
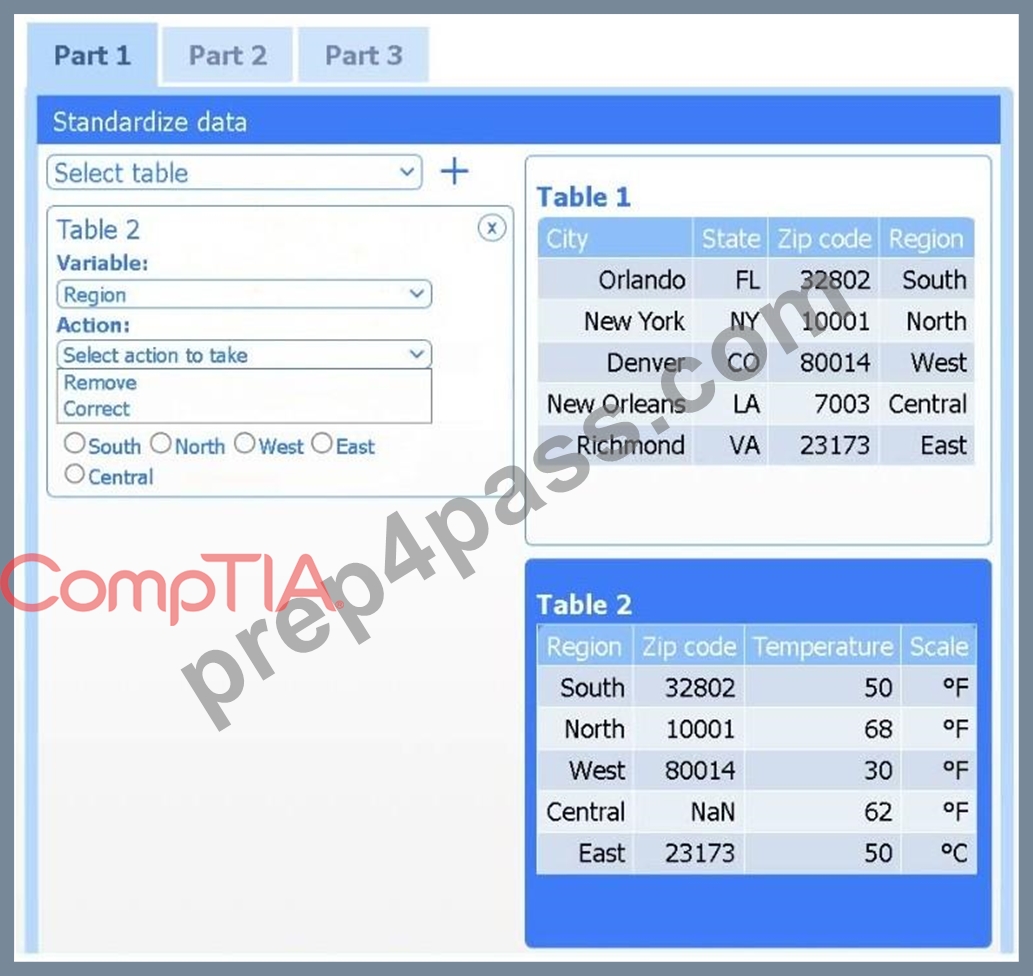
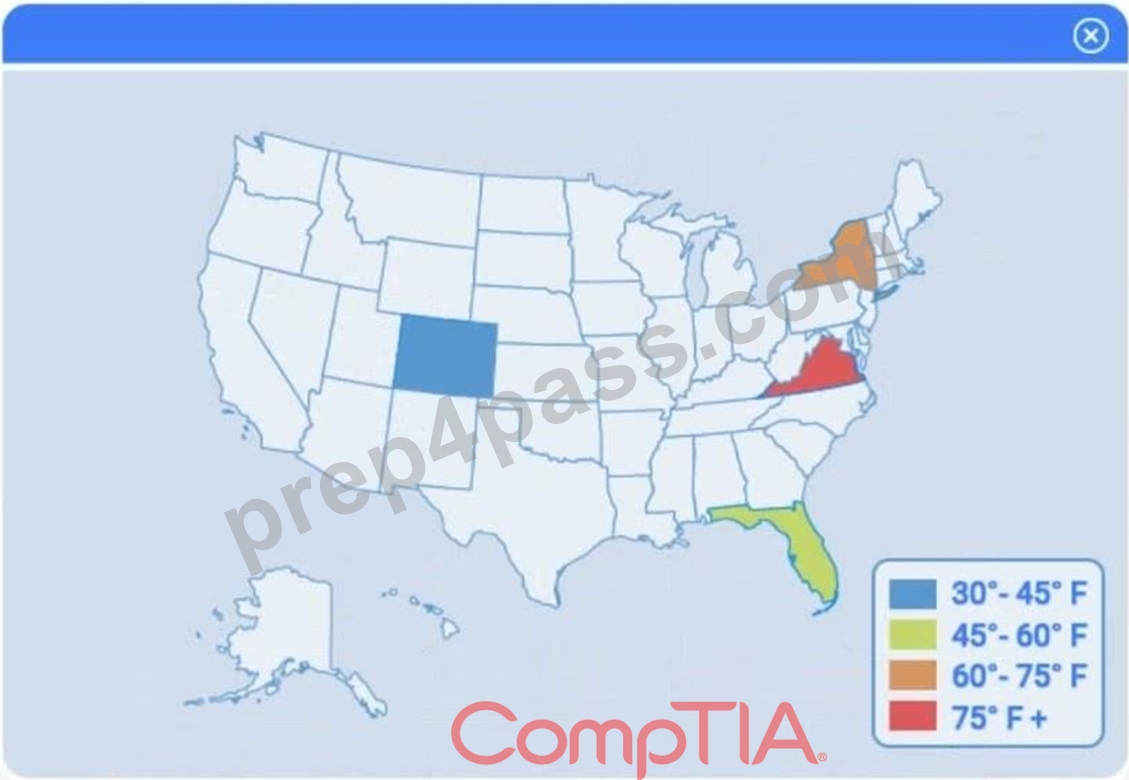
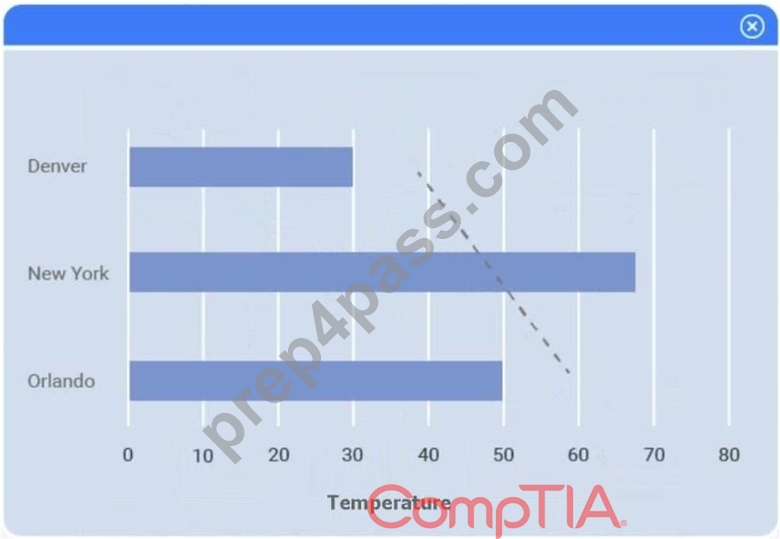
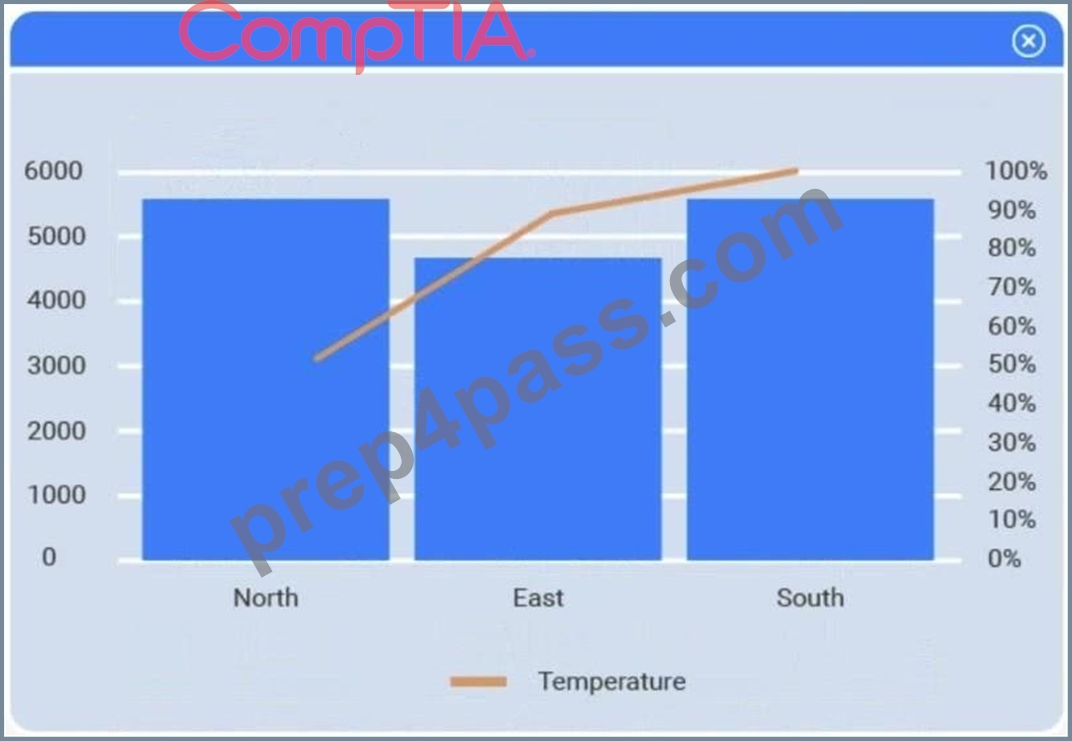
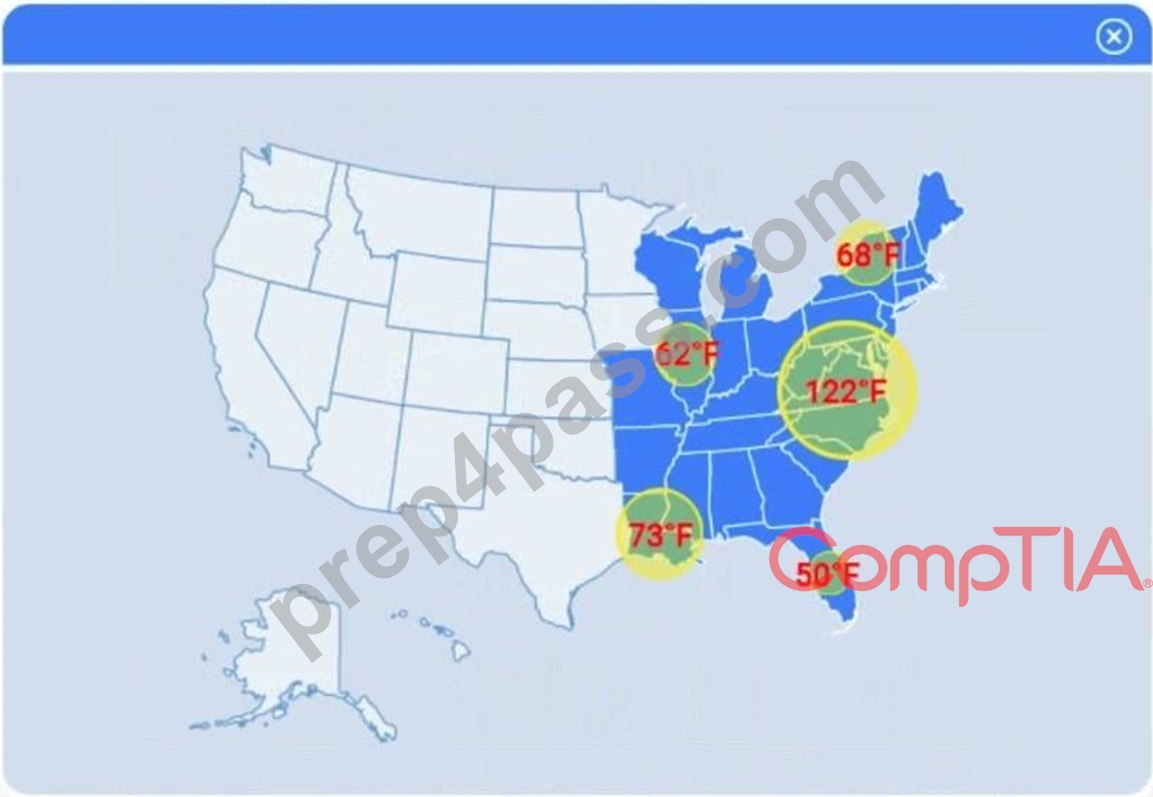
A client has gathered weather data on which regions have high temperatures. The client would like a visualization to gain a better understanding of the data.
INSTRUCTIONS
Part 1
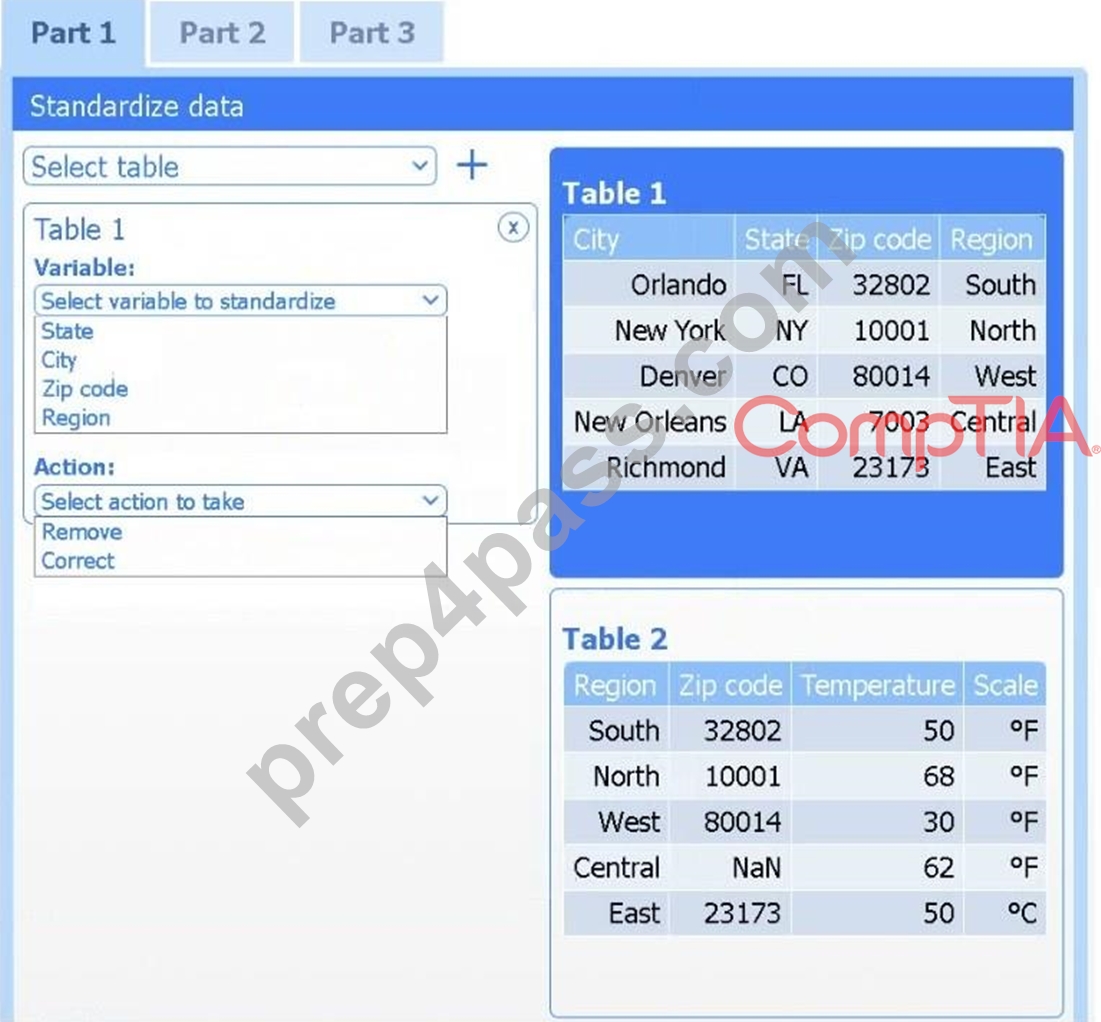
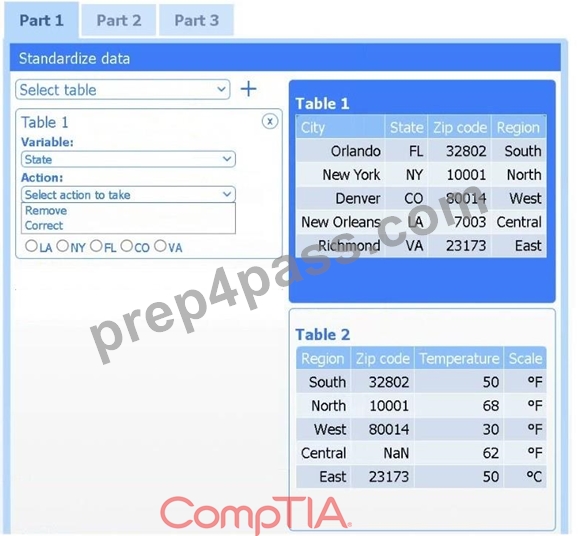
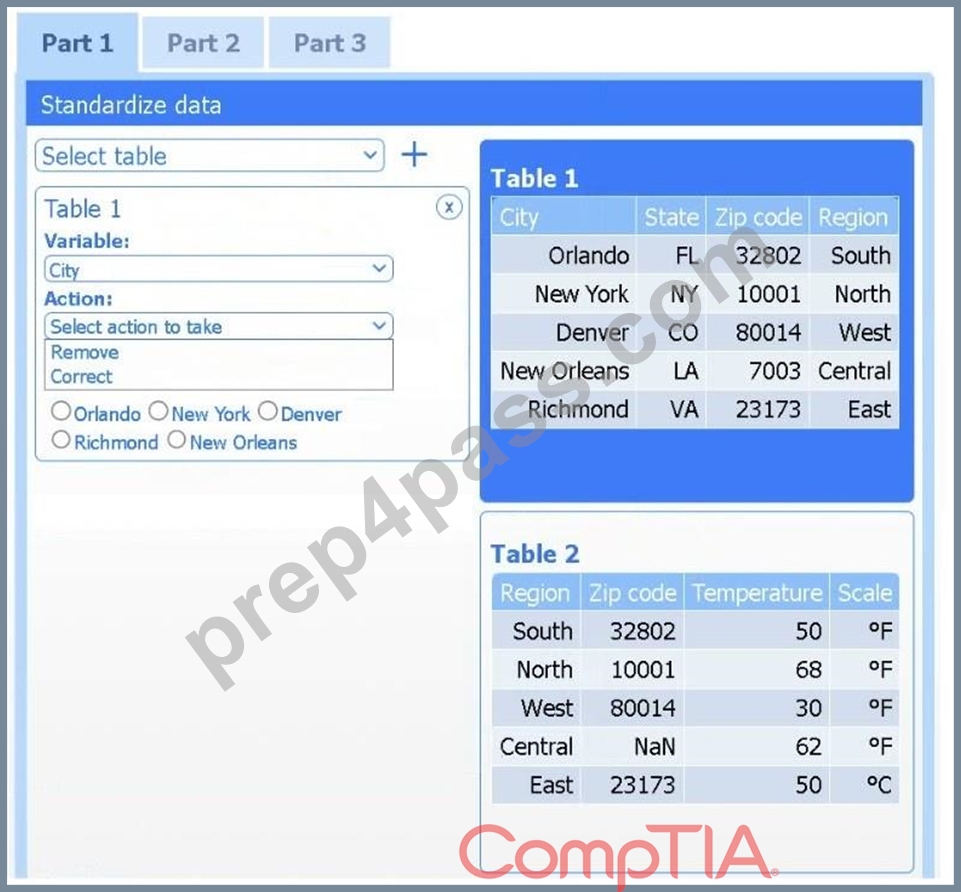
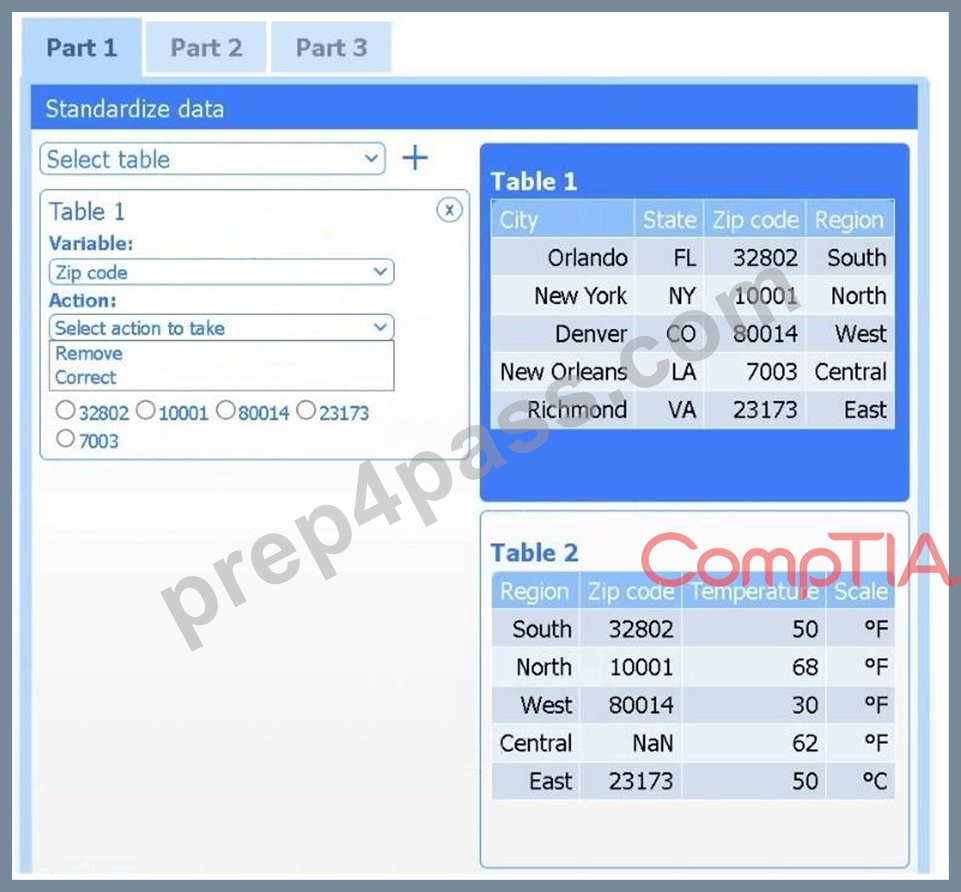
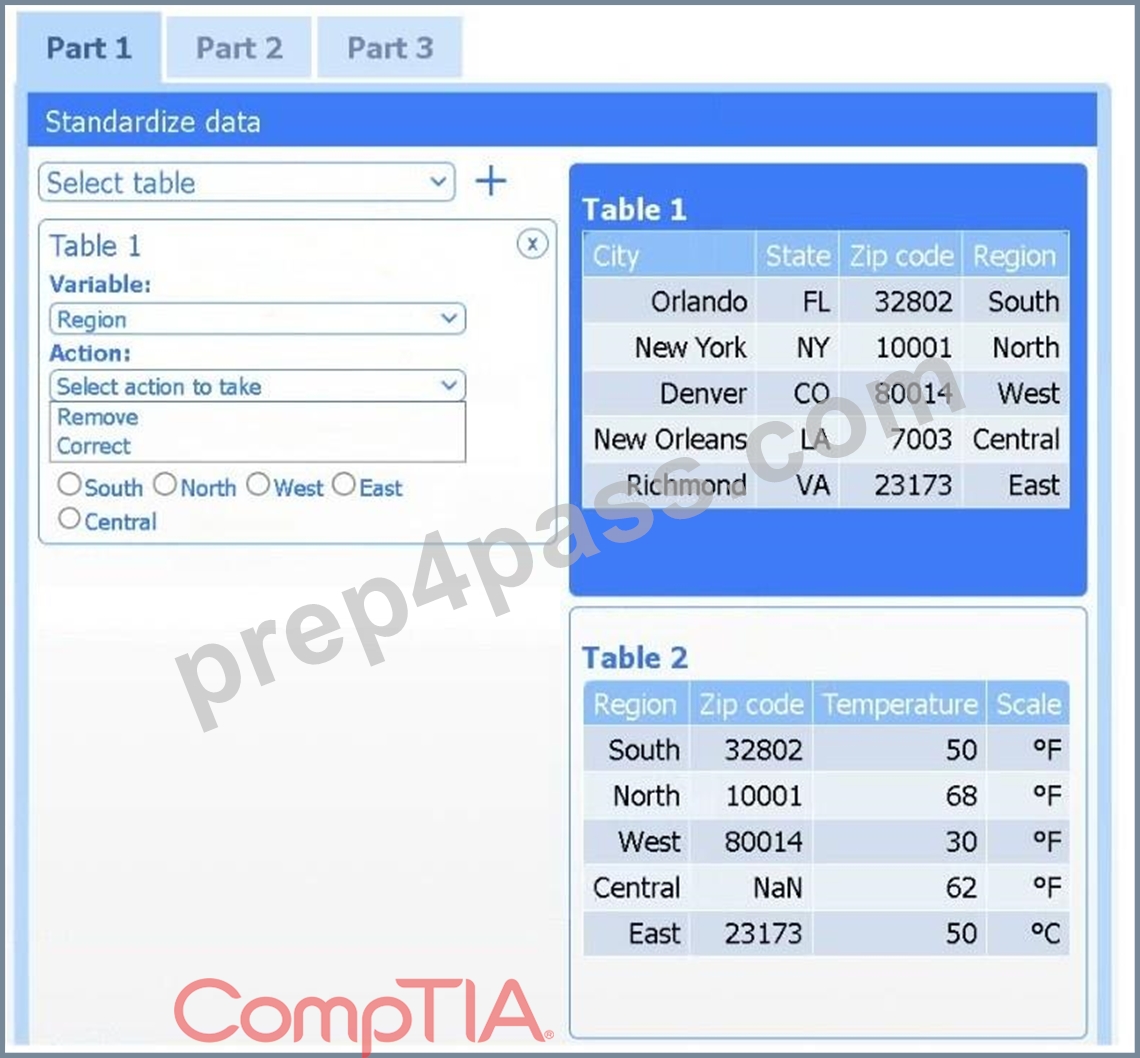
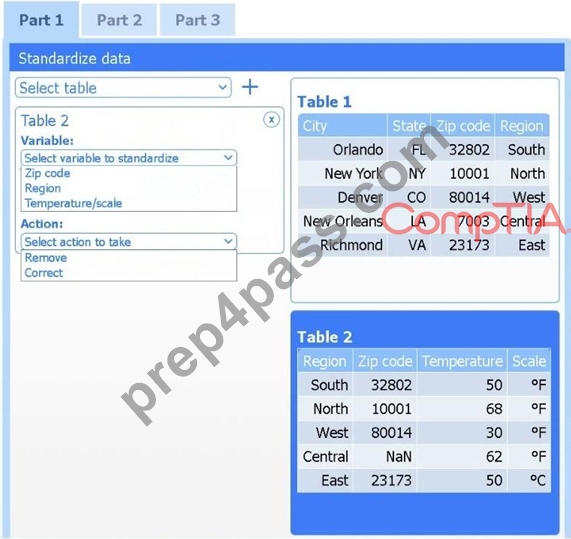
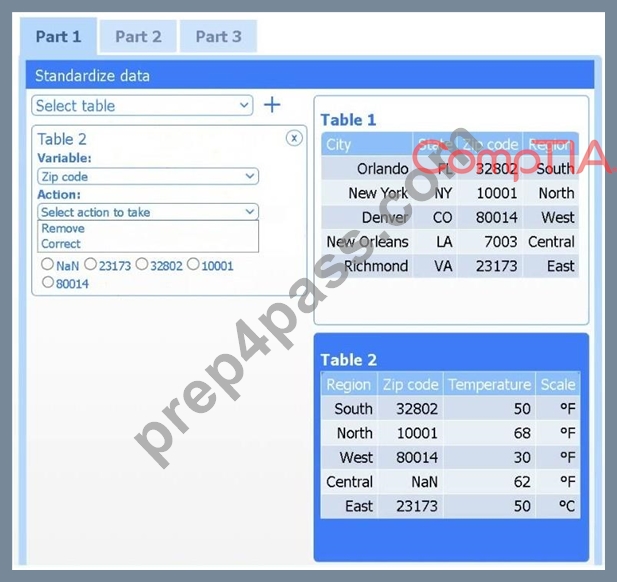
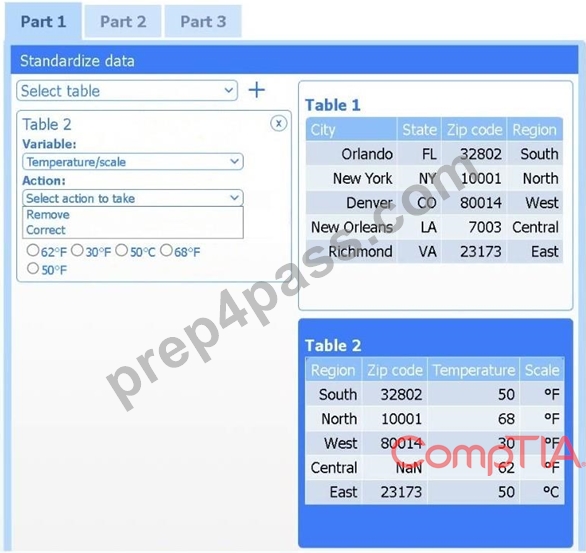
Review the charts provided and use the drop-down menu to select the most appropriate way to standardize the data.
Part 2
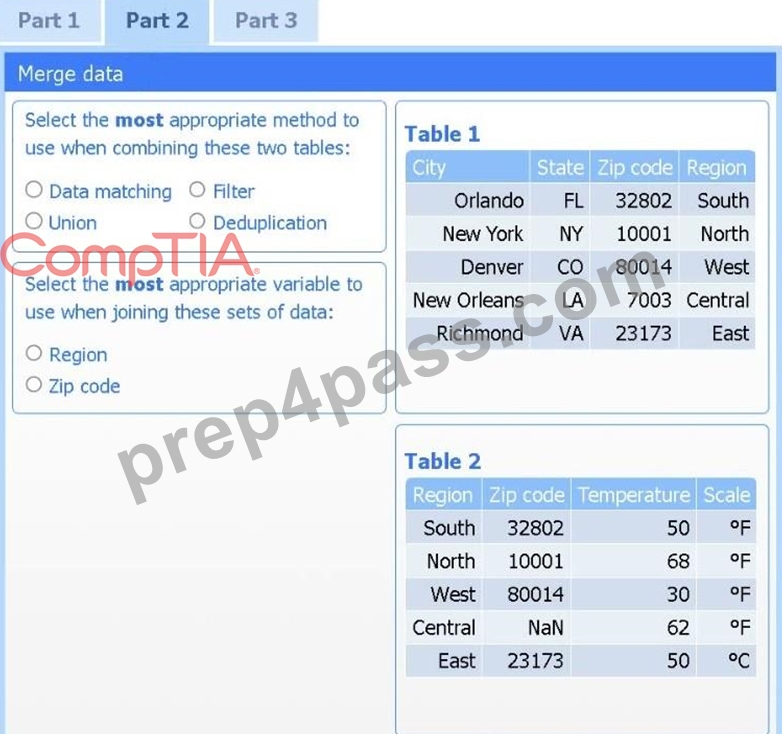
Answer the questions to determine how to create one data set.
Part 3
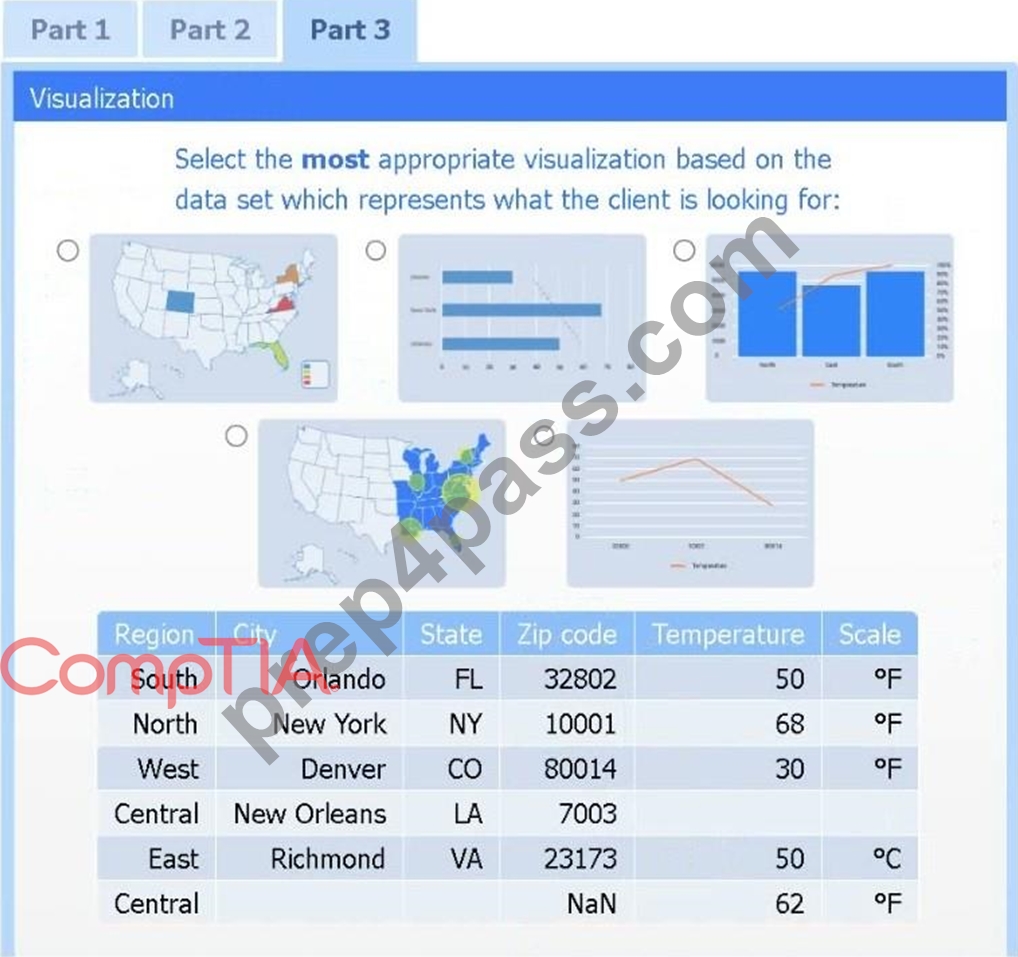
Select the most appropriate visualization based on the data set that represents what the client is looking for.
If at any time you would like to bring back the initial state of the simulation, please click the Reset All button.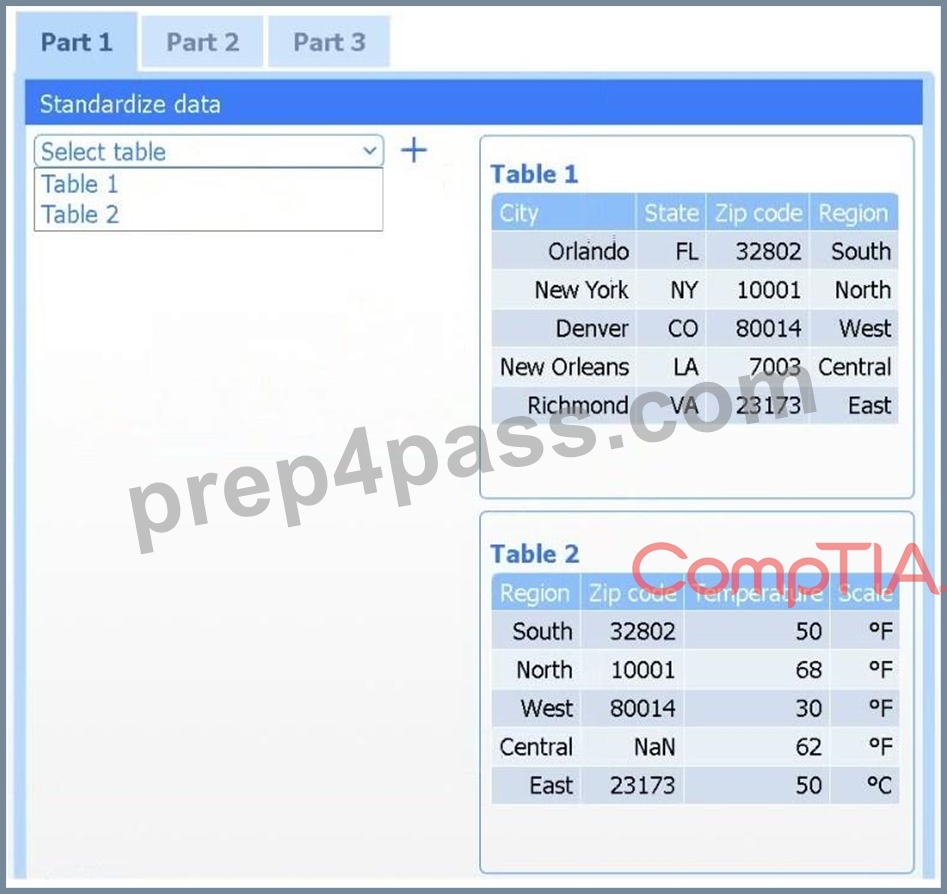
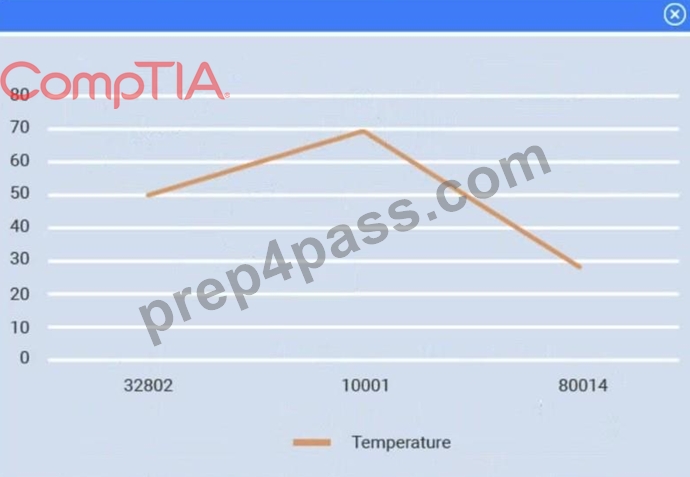
Answer:
Explanation:
Part 1
Select Table 2. Table 2 contains mixed temperature scales (°F and °C) that must be standardized before visualization.
Variable: Temperature/scale
Action: Correct
Value to correct: 50 °C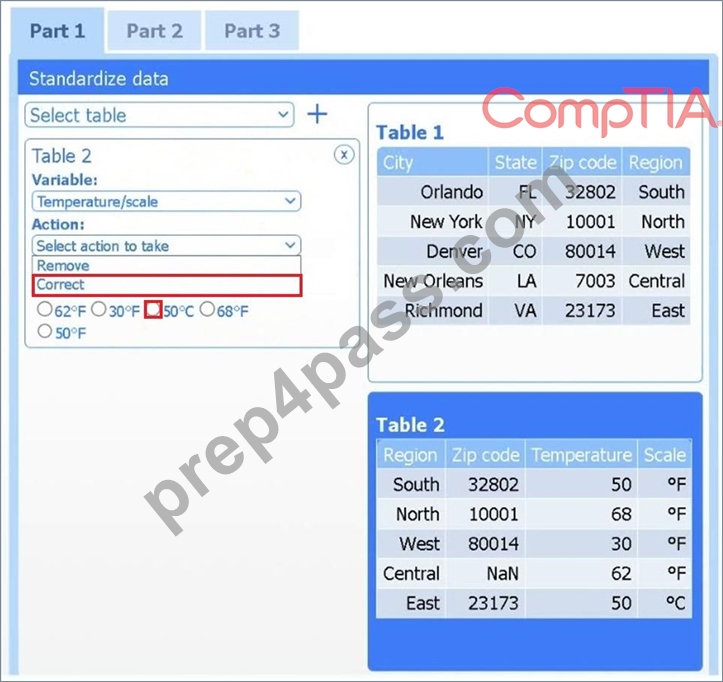
Part 2
Method: Data matching
Join variable: Zip code
You need to merge the two tables by aligning matching records, which is a data-matching (join) operation, and ZIP code is the shared, uniquely identifying field linking each region's weather reading to its city.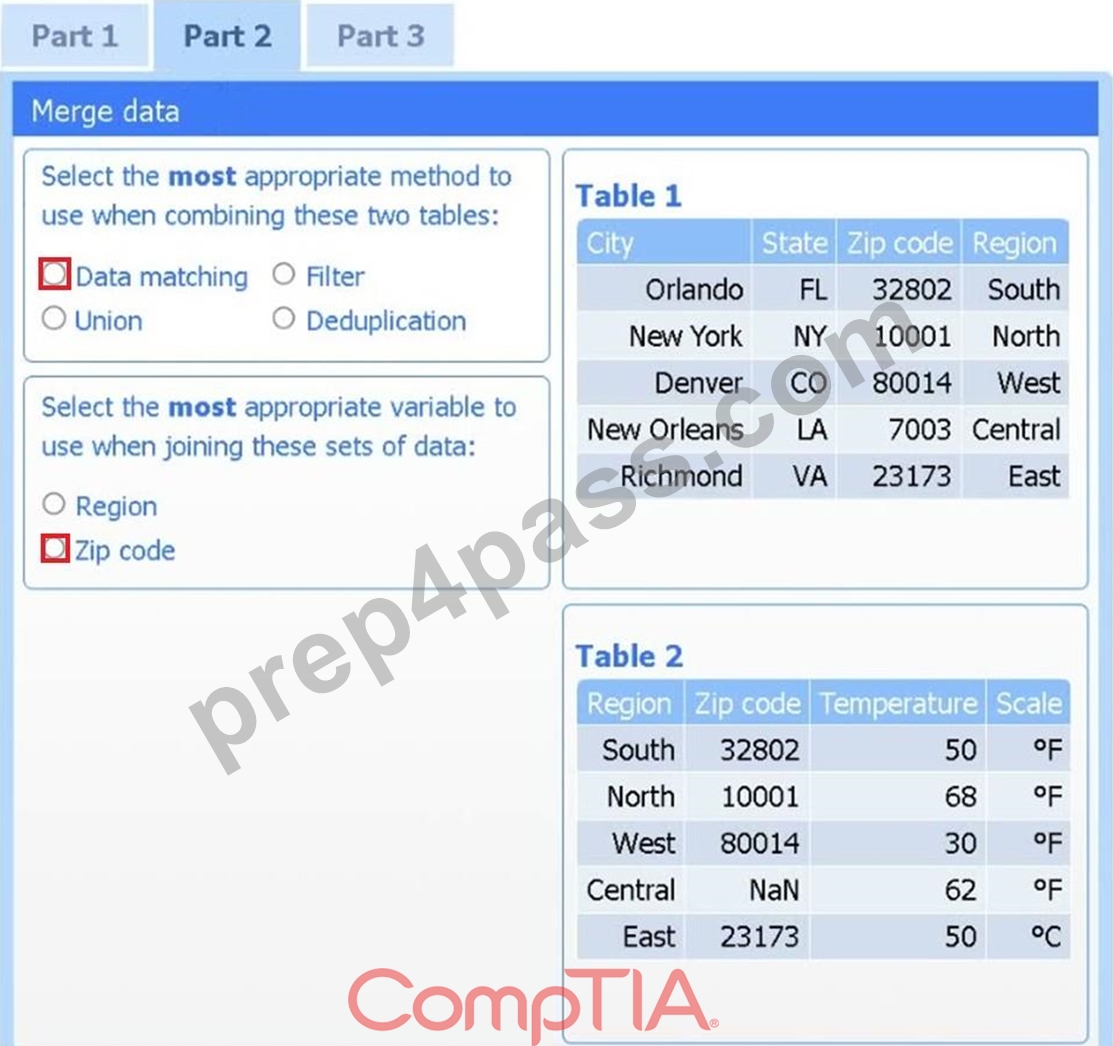
Part 3
Choose the choropleth map (the first option).
A choropleth map best shows geographic variation in temperature by coloring each state (or region) according to its recorded value. This lets the client immediately see where the highest and lowest temperatures occur across the U.S. without distracting elements like bubble size or combined chart axes.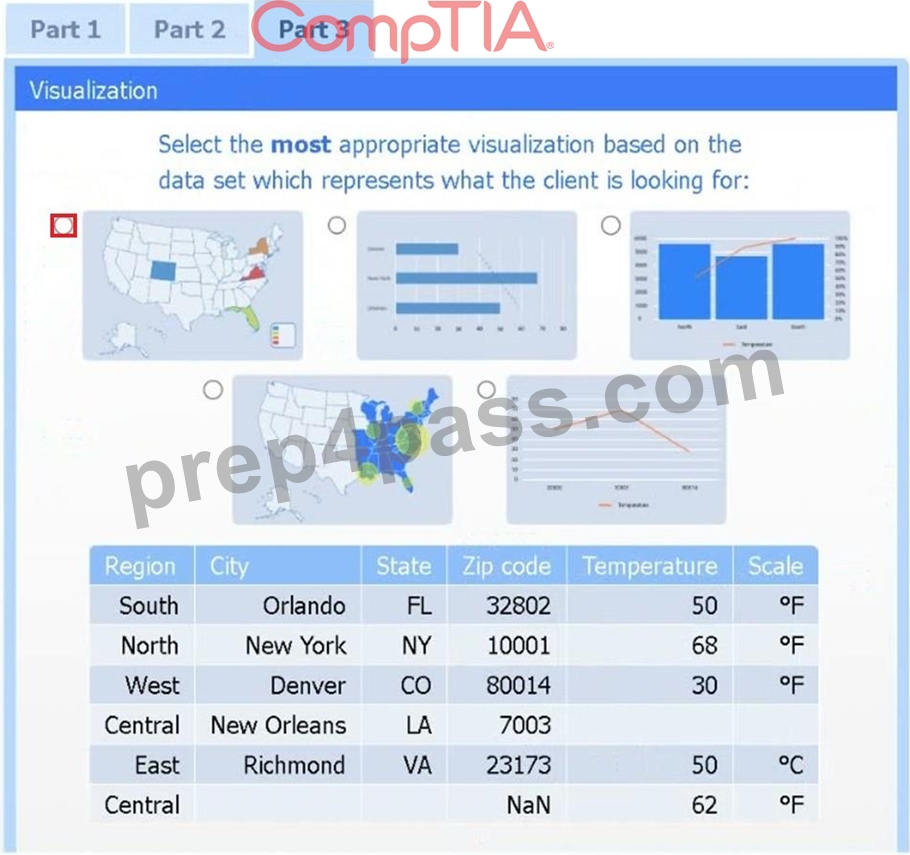
NEW QUESTION # 19
A data scientist is merging two tables. Table 1 contains employee IDs and roles. Table 2 contains employee IDs and team assignments. Which of the following is the best technique to combine these data sets?
- A. inner join between Table 1 and Table 2
- B. outer join between Table 1 and Table 2
- C. right join on Table 1 with Table 2
- D. left join on Table 1 with Table 2
Answer: A
Explanation:
An INNER JOIN merges records only where the employee ID exists in both tables, yielding a single combined table of each employee's role paired with their team assignment.
NEW QUESTION # 20
A data scientist is merging two tables. Table 1 contains employee IDs and roles. Table 2 contains employee IDs and team assignments. Which of the following is the best technique to combine these data sets?
- A. inner join between Table 1 and Table 2
- B. outer join between Table 1 and Table 2
- C. right join on Table 1 with Table 2
- D. left join on Table 1 with Table 2
Answer: A
Explanation:
# An inner join returns only those records that have matching keys (employee IDs in this case) in both tables.
Since each table provides a different attribute for the same entity (employee), an inner join is the most efficient and accurate method when focusing on employees present in both tables.
Why the other options are less ideal:
* B & C: Left or right joins would include unmatched data, which may lead to nulls.
* D: An outer join brings in all records from both tables and fills nulls where no matches exist, which may introduce irrelevant or incomplete entries.
Official References:
* CompTIA DataX (DY0-001) Official Study Guide - Section 5.2:"Inner joins are most appropriate when combining datasets with matching keys to retain only relevant, intersecting records."
* SQL for Data Analysts, Chapter 3:"Use inner joins when combining tables on a common key to include only matched data for analysis."
-
NEW QUESTION # 21
A data scientist uses a large data set to build multiple linear regression models to predict the likely market value of a real estate property. The selected new model has an RMSE of 995 on the holdout set and an adjusted R2 of .75. The benchmark model has an RMSE of 1,000 on the holdout set. Which of the following is the best business statement regarding the new model?
- A. The model should be deployed because it has a lower RMSE.
- B. The model's adjusted R2 is too low for the real estate industry.
- C. The model fails to improve meaningfully on the benchmark model.
- D. The model's adjusted R2 is exceptionally strong for such a complex relationship.
Answer: C
Explanation:
Although the new model's RMSE is technically lower (995 vs. 1,000), the five‐point improvement on holdout data is negligible in most real-estate contexts and unlikely to produce meaningful business value over the existing benchmark.
NEW QUESTION # 22
A data scientist wants to digitize historical hard copies of documents. Which of the following is the best method for this task?
- A. Optical character recognition
- B. Word2vec
- C. Latent semantic analysis
- D. Semantic segmentation
Answer: A
Explanation:
OCR converts scanned images of text into machine‐readable characters, making it the appropriate tool for digitizing printed or handwritten historical documents.
NEW QUESTION # 23
A data scientist would like to model a complex phenomenon using a large data set composed of categorical, discrete, and continuous variables. After completing exploratory data analysis, the data scientist is reasonably certain that no linear relationship exists between the predictors and the target. Although the phenomenon is complex, the data scientist still wants to maintain the highest possible degree of interpretability in the final model. Which of the following algorithms best meets this objective?
- A. Decision tree
- B. Artificial neural network
- C. Multiple linear regression
- D. Random forest
Answer: A
Explanation:
Decision trees capture complex, nonlinear relationships with a transparent, rule-based structure. They remain highly interpretable (each split can be visualized and explained) unlike ensembles (random forests) or neural networks, and they don't rely on linear assumptions.
NEW QUESTION # 24
A data scientist would like to model a complex phenomenon using a large data set composed of categorical, discrete, and continuous variables. After completing exploratory data analysis, the data scientist is reasonably certain that no linear relationship exists between the predictors and the target. Although the phenomenon is complex, the data scientist still wants to maintain the highest possible degree of interpretability in the final model. Which of the following algorithms best meets this objective?
- A. Decision tree
- B. Artificial neural network
- C. Multiple linear regression
- D. Random forest
Answer: A
Explanation:
# Decision trees offer excellent interpretability while handling complex, non-linear relationships and multiple variable types (categorical, discrete, continuous). They provide easy-to-understand visualizations and logic- based rules, making them ideal when transparency and insight are priorities.
Why other options are incorrect:
* A: Neural networks are powerful but are considered "black box" models, with low interpretability.
* C: Linear regression assumes a linear relationship, which contradicts the scenario.
* D: Random forests are ensembles of trees - more accurate, but less interpretable.
Official References:
* CompTIA DataX (DY0-001) Study Guide - Section 4.2:"Decision trees are interpretable models that support non-linear, multi-type data with logical branching."
-
NEW QUESTION # 25
A data scientist is deploying a model that needs to be accessed by multiple departments with minimal development effort by the departments. Which of the following APIs would be best for the data scientist to use?
- A. SOAP
- B. REST
- C. JSON
- D. RPC
Answer: B
Explanation:
RESTful APIs use standard HTTP methods and lightweight data formats (typically JSON), making them easy for diverse teams to integrate with minimal effort and without heavy tooling.
NEW QUESTION # 26
Which of the following types of layers is used to downsample feature detection when using a convolutional neural network?
- A. Output
- B. Pooling
- C. Input
- D. Hidden
Answer: B
Explanation:
# Pooling layers are used in Convolutional Neural Networks (CNNs) to reduce the spatial dimensions (width and height) of the feature maps. This helps in downsampling, reducing computational complexity, and controlling overfitting by summarizing the features (e.g., max pooling or average pooling).
Why the other options are incorrect:
* B: Input layers receive raw data and do not perform downsampling.
* C: Output layers generate the final prediction.
* D: Hidden layers process data but do not specifically perform downsampling unless designed to do so (e.g., convolutional or pooling sublayers).
Official References:
* CompTIA DataX (DY0-001) Study Guide - Section 4.3:"Pooling layers are used to downsample feature maps and are critical in CNNs for reducing dimensions."
-
NEW QUESTION # 27
A data scientist is developing a model to predict the outcome of a vote for a national mascot. The choice is between tigers and lions. The full data set represents feedback from individuals representing 17 professions and 12 different locations. The following rank aggregation represents 80% of the data set: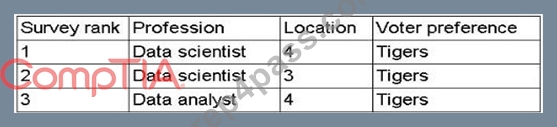
Which of the following is the most likely concern about the model's ability to predict the outcome of the vote?
- A. Extrapolated data
- B. In-sample data
- C. Interpolated data
- D. Out-of-sample data
Answer: D
Explanation:
The aggregated feedback covers only 80% of respondents, mostly from a few professions and locations, so the model hasn't "seen" the remaining 20% (and those underrepresented groups). Its performance on those unseen subsets (out-of-sample data) is therefore the primary concern for how well it will predict the actual vote.
NEW QUESTION # 28
A data scientist is presenting the recommendations from a monthslong modeling and experiment process to the company's Chief Executive Officer. Which of the following is the best set of artifacts to include in the presentation?
- A. Methods, data overview, results, recommendations, and charts
- B. Results, recommendations, justifications, and clear charts
- C. Recommendation charts justifications code reviews and results
- D. Methodology, code snippets, findings, data tables, and p values
Answer: B
Explanation:
Executive audiences need concise, high-level insights: what you found (results), what you suggest (recommendations), why it matters (justifications), and visual summaries (clear charts). Detailed methods, code, or raw data aren't appropriate at the C-suite level.
NEW QUESTION # 29
A data scientist is presenting the recommendations from a monthslong modeling and experiment process to the company's Chief Executive Officer. Which of the following is the best set of artifacts to include in the presentation?
- A. Methods, data overview, results, recommendations, and charts
- B. Methodology, code snippets, findings, data tables, and p-values
- C. Recommendation, charts, justifications, code reviews, and results
- D. Results, recommendations, justifications, and clear charts
Answer: D
Explanation:
# For executive-level presentations, the focus should be on strategic outcomes. Therefore, concise results, clear actionable recommendations, visual summaries (charts), and minimal justifications are best. Technical details such as p-values, code, or full methods are too granular.
Why the other options are incorrect:
* A: Too method-heavy for executive audiences.
* C: Includes code reviews - not suitable for a CEO.
* D: Overly technical for high-level stakeholders.
Official References:
* CompTIA DataX (DY0-001) Study Guide - Section 5.5:"Executive communication should focus on outcome-driven recommendations, high-level insights, and actionable visuals."
* Harvard Business Review - Communicating Data to Executives:"Avoid technical detail. Use visuals and clearly stated recommendations supported by business-focused justifications."
NEW QUESTION # 30
A data scientist is attempting to identify sentences that are conceptually similar to each other within a set of text files. Which of the following is the best way to prepare the data set to accomplish this task after data ingestion?
- A. Extrapolation
- B. Embeddings
- C. One-hot encoding
- D. Sampling
Answer: B
Explanation:
# Embeddings (e.g., word2vec, sentence transformers) are vector representations of text that capture semantic similarity. They allow comparison of conceptual meaning between sentences in a high-dimensional space, which is essential for tasks like semantic similarity or clustering.
Why the other options are incorrect:
* B: Extrapolation predicts values beyond a dataset's range - not relevant here.
* C: Sampling reduces data volume but doesn't aid in similarity analysis.
* D: One-hot encoding captures presence of words but lacks semantic understanding.
Official References:
* CompTIA DataX (DY0-001) Study Guide - Section 6.3:"Embeddings transform text into numeric vectors, enabling similarity computation and semantic analysis."
-
NEW QUESTION # 31
An analyst is examining data from an array of temperature sensors and sees that one sensor consistently returns values that are much higher than the values from the other sensors. Which of the following terms best describes this type of error?
- A. Synthetic
- B. Heteroskedastic
- C. Idiosyncratic
- D. Systematic
Answer: D
Explanation:
# A systematic error is a consistent, repeatable error caused by faulty equipment or flawed measurement techniques. Since one sensor consistently over-reports values, this is a classic case of systematic error.
Why the other options are incorrect:
* A: Synthetic data is artificially generated - unrelated to sensor malfunction.
* C: Heteroskedasticity refers to non-constant variance - not consistent bias.
* D: Idiosyncratic errors are random and unpredictable - not consistent.
Official References:
* CompTIA DataX (DY0-001) Study Guide - Section 1.4:"Systematic errors arise from consistent biases in measurement devices or methods, requiring calibration or correction."
-
NEW QUESTION # 32
A data analyst wants to use compression on an analyzed data set and send it to a new destination for further processing. Which of the following issues will most likely occur?
- A. Operating system support will be missing.
- B. Server memory usage will be too high.
- C. Server CPU usage will be too high.
- D. Library dependency will be missing.
Answer: C
Explanation:
Compression and decompression are CPU‐intensive operations; on large data sets, the extra processing load can significantly spike CPU utilization. Memory, OS support, or library dependencies are far less likely to be the primary bottleneck in a standard compression workflow.
NEW QUESTION # 33
Which of the following methods should a data scientist use just before switching to a potential replacement model?
- A. Containerization
- B. CI/CD
- C. Performance monitoring
- D. A/B testing
Answer: D
Explanation:
A/B testing lets you compare the current model against the candidate in parallel, measuring performance on live data, before fully switching to the new model.
NEW QUESTION # 34
......
CompTIA DY0-001 Exam Syllabus Topics:
| Topic | Details |
|---|---|
| Topic 1 |
|
| Topic 2 |
|
| Topic 3 |
|
| Topic 4 |
|
| Topic 5 |
|
Pass Your Next DY0-001 Certification Exam Easily & Hassle Free: https://www.prep4pass.com/DY0-001_exam-braindumps.html
Get Prepared for Your DY0-001 Exam With Actual CompTIA Study Guide!: https://drive.google.com/open?id=1-H2OwyryCjssTsKRCRlYRwV9Imwm76mk
