

A00-470 Dumps are Available for Instant Access [2025]
Practice with these A00-470 dumps Certification Sample Questions
NEW QUESTION # 56
Refer to the exhibits: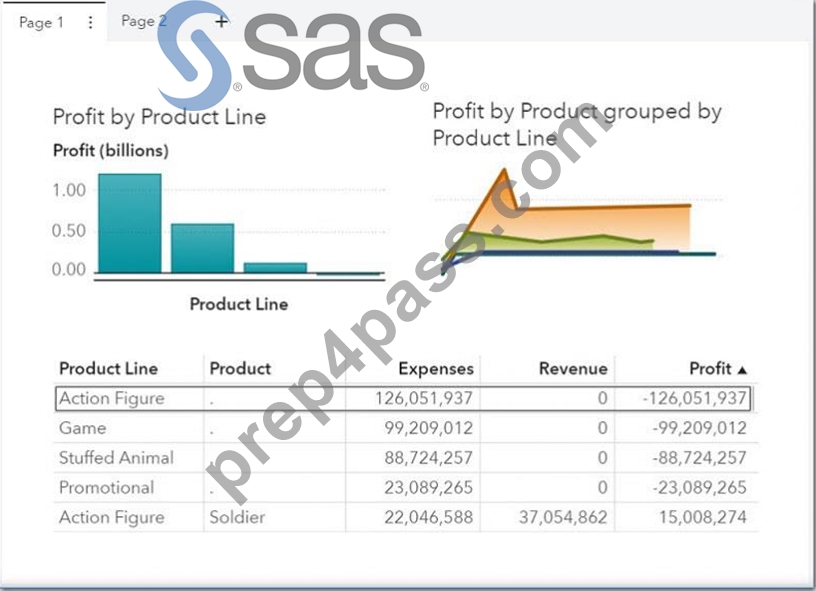
How do you change the report in Exhibit A to look like Exhibit B?
- A. Select the report in the Options pane, select Padding, and then enter a number.
- B. Right-click the report name, select Padding, and then enter a number.
- C. Select the report in the Options pane, select Margins, and then enter a number.
- D. Right-click the canvas, select White space, and then enter a number.
Answer: A
NEW QUESTION # 57
The content developer has just changed the filter to add more data to this line chart in SAS visual analytics Explorer, are some of the lines outside of view?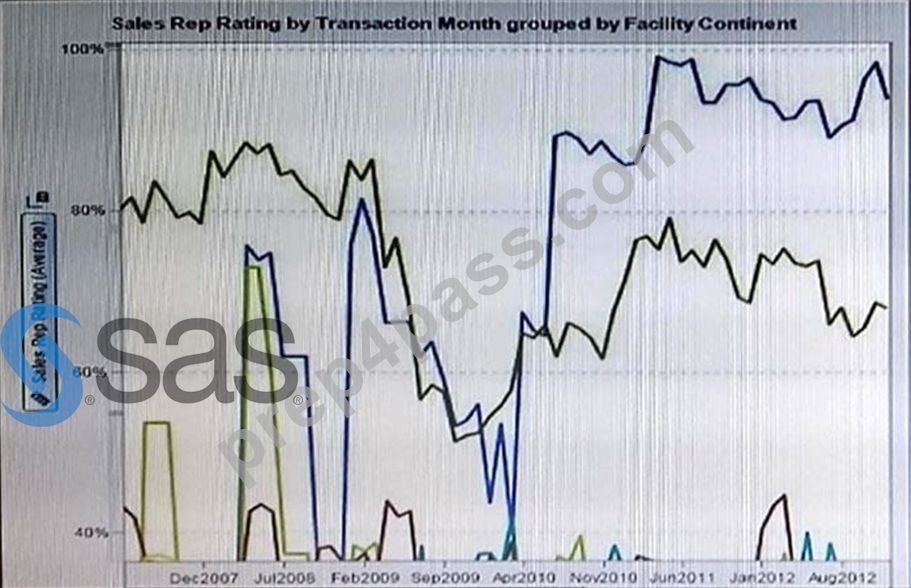
- A. The data does not fit
- B. The vertical Axis is locked
- C. Data Outside of the can be ignored
- D. there is too much data for a line chart
Answer: A
NEW QUESTION # 58
When importing a Microsoft Excel file using local files, what changes can be made to the destination table?
- A. Hide columns
- B. Filter rows
- C. Rename table
- D. Format columns
Answer: C
NEW QUESTION # 59
Which statement is NOT true about text objects?
- A. Able to define dynamic text.
- B. Able to define display rules.
- C. Able to define a link to a target report.
- D. Able to define an action to a target object.
Answer: D
NEW QUESTION # 60
In SAS Visual Analytics Designer, which part of the user interface allows you to change the classification property of a data item.
- A. Select options on the data tab, and select measure details.
- B. Select options on the data tab, and select Data properties.
- C. Roles tab in the right pane
- D. Right click on the data item
Answer: B
NEW QUESTION # 61
Refer to the exhibit: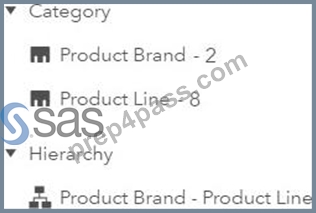
What gets automatically created when the report designer drags the hierarchy into the report prompt area?
- A. Two parameters.
- B. A drop-down list for Product Brand.
- C. A button bar for Product Line.
- D. A filter action from Product Brand to Product Line.
Answer: D
NEW QUESTION # 62
For a cross tab report object created in SAS Visual Analytics Designer, which statement is true?
- A. Ascending and descending sorting may be used with both row and column data items but a custom sort can only be used with row data items.
- B. A geography data item that has custom latitude and longitude specified may be added to row data items.
- C. Filters may be applied to both row and column data items, but ranks can only be applied to row data items.
- D. If a hierarchy data item is assigned to the rows role, no other data items may be assigned to the rows role.
Answer: D
NEW QUESTION # 63
Refer to the exhibit below, Descending bar chart is given: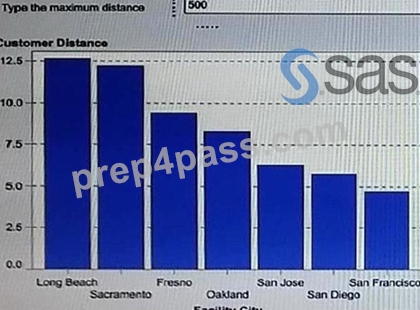
The text input control is used to filter the bar chart.
How was this accomplished?
- A. A filter interaction was established between the text input control and the bar chart
- B. A Calculated item was created and assigned to the text input control and used in an advanced filter on the bar chart.
- C. A parameter was created and assigned to the text input control and used in an advanced filter on the bar chart
- D. A rank was established between the text input control and the bar chart
Answer: A
NEW QUESTION # 64
Which statement is TRUE about report alerts?
- A. Alert notifications can be sent to subscribers via email.
- B. Alerts can be set on an individual object and the entire report.
- C. Alert notifications are only sent to the user that created the alert.
- D. Alert notifications are only sent when the report is open.
Answer: A
NEW QUESTION # 65
A content developer working in SAS Visual Analytics Designer, the user interface will not allow the content developer to add a list control to the report prompt area.
What must the content developer do so that the list control can be added to the report prompt area?
- A. Set the global option properly on the list control and then add it.
- B. Increase the size of the report prompt area then add the list control
- C. Add the list control to the report canvas and use the duplicate / paste options.
- D. Add a container and then add the list control to the container
Answer: D
NEW QUESTION # 66
Which part of the user interface allows you to change the classification of a measure data item?
- A. You cannot change the classification of a measure data item.
- B. Select Options in the Data pane and select Change classification.
- C. Right-click the data item in the Data pane and select Convert to category.
- D. Use the Category role in the Roles pane.
Answer: C
NEW QUESTION # 67
Refer to the exhibit: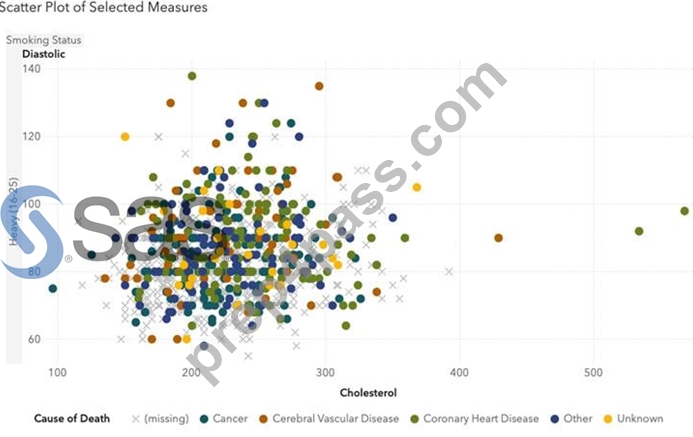
To which role is the data item "Smoking Status" assigned?
- A. Lattice rows
- B. Lattice columns
- C. Y axis
- D. Filter
Answer: A
NEW QUESTION # 68
Which action will cause a list table object to display rows of detail data instead of aggregated data?
- A. Add a new display rule and select Detail Rows for the Applies to value.
- B. Include a hierarchy data item in the table and expand the hierarchy to the lowest level.
- C. Include only data items that have an aggregation of 'None'.
- D. Select Detail data in the Options pane.
Answer: D
NEW QUESTION # 69
When working with the text topics object, what must the report designer set in order to use it in a report?
- A. Unique row identifier
- B. Measure
- C. Category
- D. Sentiment collection
Answer: A
NEW QUESTION # 70
Refer to the exhibit: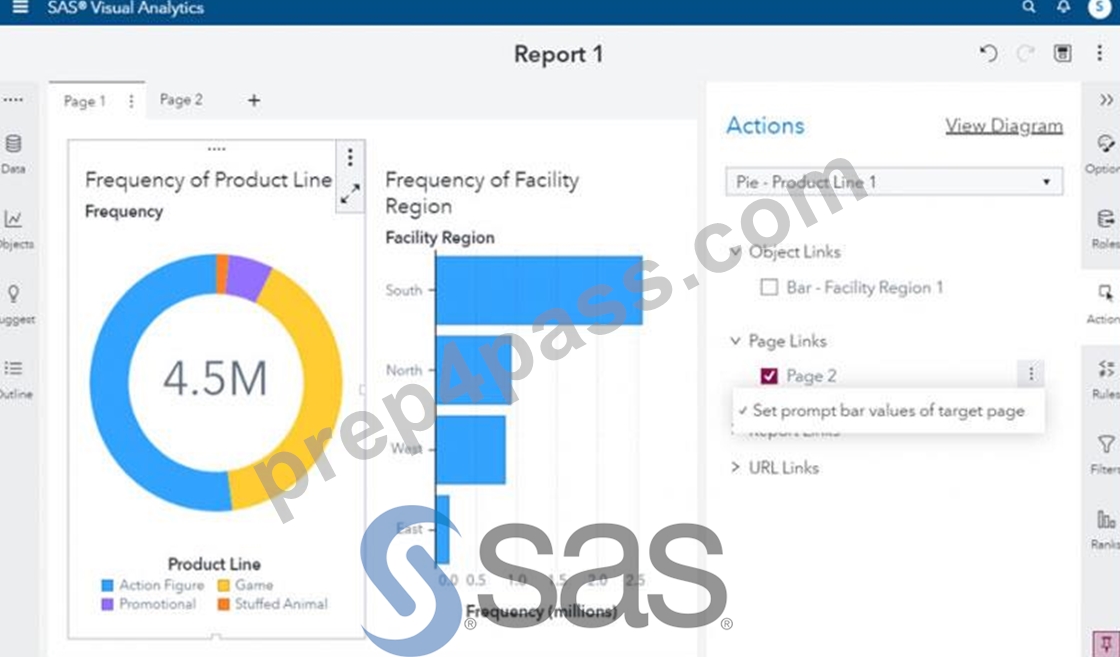
If Set prompt bar values of target page is selected in the Actions pane, what happens when you double click the pie chart to link to Page 2?
- A. The bar chart Facility Region values are also linked to Page 2.
- B. A control object based on Product Line is automatically added to Page 2 prompt area.
- C. You are given the chance to select a different Product Line while in Page 2.
- D. The selected Product Line value is automatically displayed in the Page 2 title.
Answer: C
NEW QUESTION # 71
Refer the exhibit below: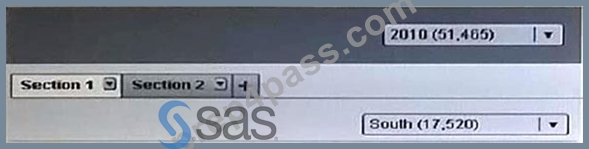
A content developer creates the above report in SAS Visual Analytics Designer. The report contains a report prompt, where year is set to 2010, and a section prompt on section 1 where region is set to south.
How will this report be filtered based on these prompt values?
- A. Section1 will be filtered for Year=2010 and region=south. section 2 will be filtered for year=2010
- B. Section1 will be filtered for region=south. section 2 will be filtered for year=2010
- C. Section1 will be filtered for Year=2010 and region=south. section 2 will not be filtered.
- D. Section1 and section 2 will be filtered for region=south and for year=2010
Answer: A
NEW QUESTION # 72
Which action in the SAS Visual Analytics Explorer creates Stacked bar charts: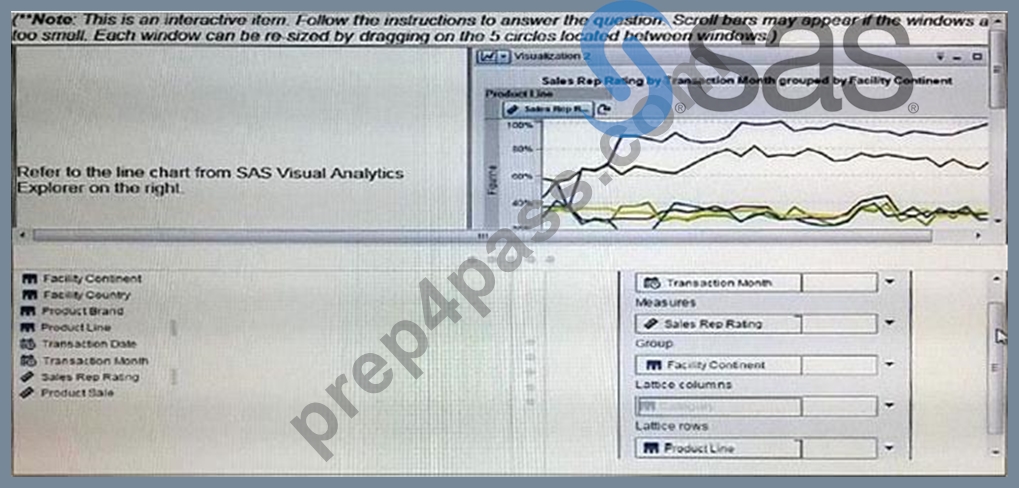
- A. Assign a category to the lattice columns, then select stack as the display rule.
- B. Assign a category to the group role, then select stack as the grouping style in the properties tab
- C. Assign a category to the Grouping role
- D. Assign a category to the Grouping Style
Answer: B
NEW QUESTION # 73
Refer to the exhibit below: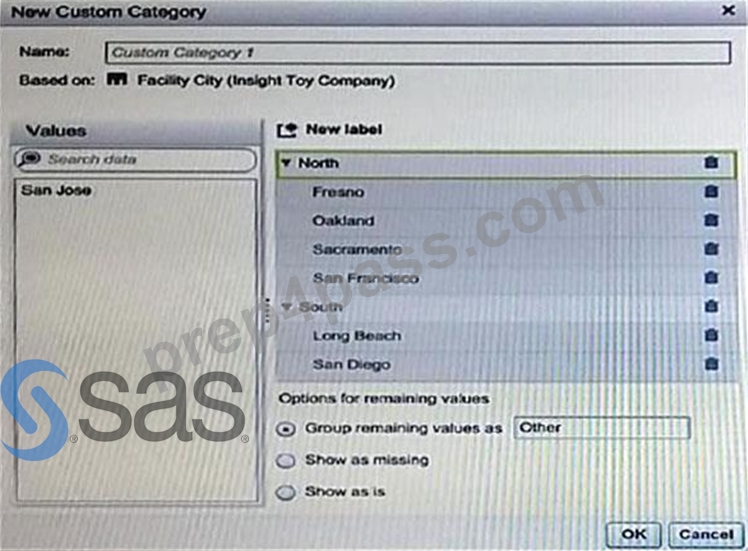
Assuming that there are data values for each city, how many different labels will be displayed when using this data item?
- A. 0
- B. 1
- C. 2
- D. 3
Answer: B
NEW QUESTION # 74
......
Get Instant Access REAL A00-470 DUMP Pass Your Exam Easily: https://www.prep4pass.com/A00-470_exam-braindumps.html
A00-470 Free Exam Questions with Quality Guaranteed: https://drive.google.com/open?id=1wQPdGauKBOIDjr-Oeq11VbTxkytHzx39
